The Numbers and Who Counts Them
The Federal Numbers Come From Tax Forms, and That Is Why They Are Slow
Photo: Tima Miroshnichenko / Pexels
Three sources, one industry, very different arrival times
Anyone tracking US beer production quickly runs into a frustrating fact: the most authoritative federal figures are also the slowest to arrive. The Alcohol and Tobacco Tax and Trade Bureau publishes monthly shipment data compiled from excise-tax returns — the same filings brewers use to settle their federal tax bills. Because those returns flow in on brewery-specific schedules and must be processed before TTB can aggregate them, the published numbers typically lag the period they describe by two to three months. A figure labelled "January" may not appear until late March or April.
The mechanism is structural, not bureaucratic sloppiness. Under federal law, brewers pay excise tax on beer removed from bond — that is, beer leaving the brewery for sale — not on beer produced. The TTB's published series therefore measures removals, not output, which matters when inventory builds or contracts. During the pandemic-era supply disruptions of 2020–2021, the two figures diverged visibly, and analysts who confused them drew different conclusions about whether the industry was shrinking or simply stockpiling.
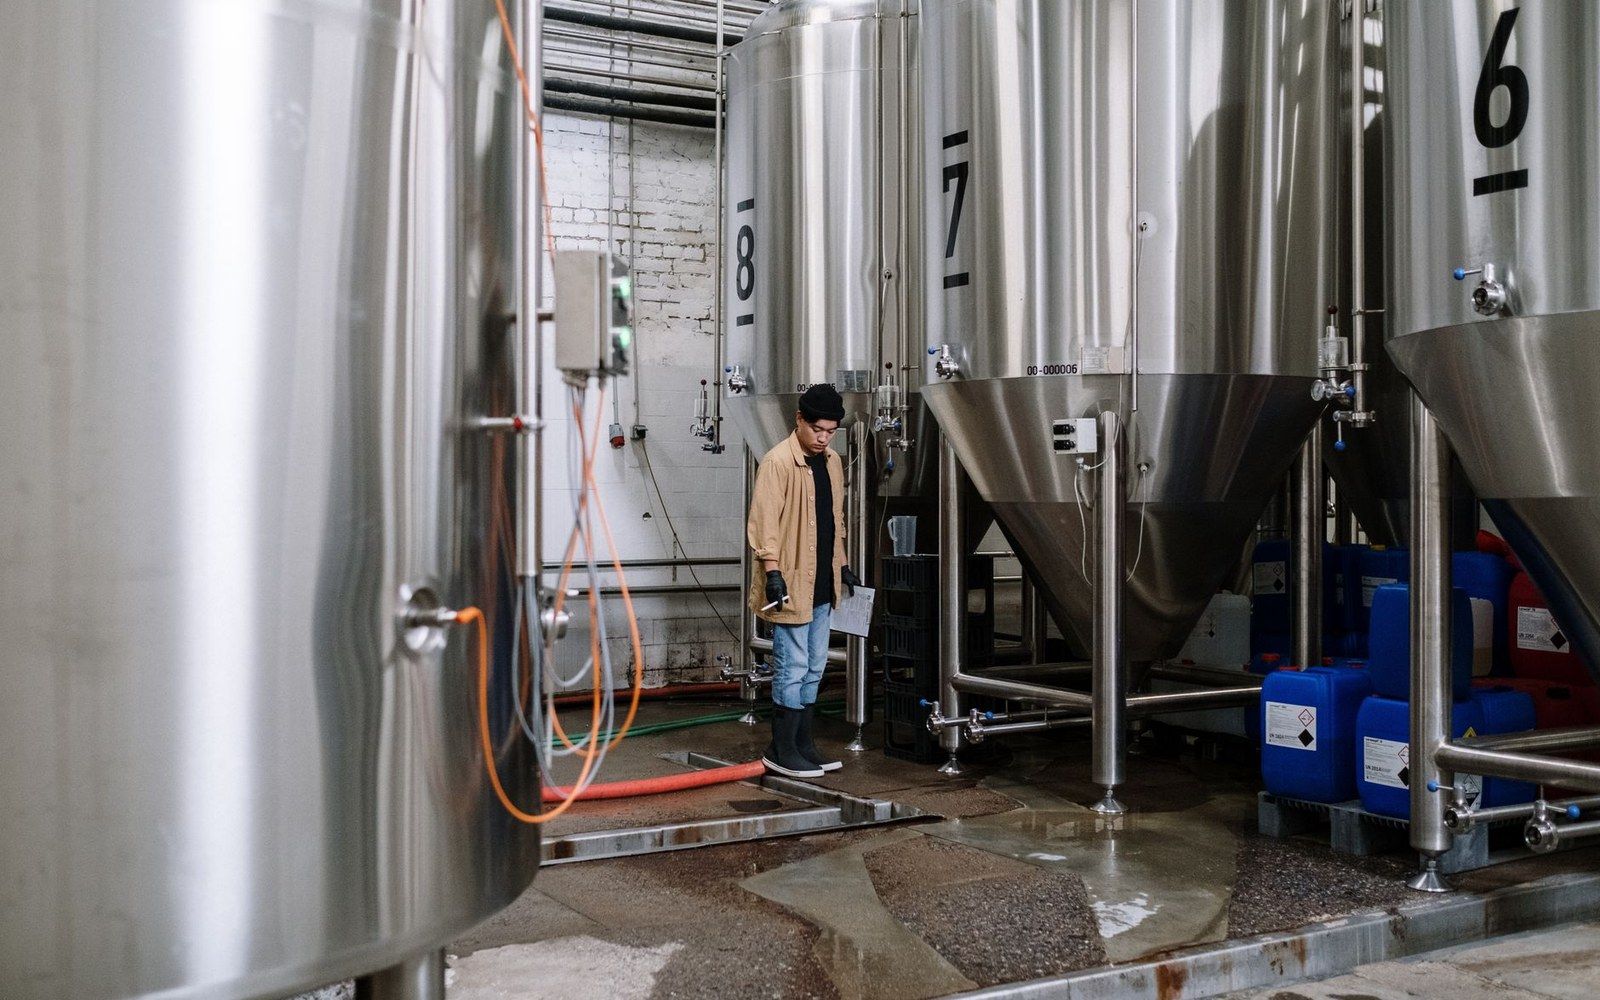
Tank capacity is the constraint behind the lager swing: cold conditioning holds a vessel for weeks rather than days.
Photo: cottonbro studio / PexelsWhat the Beer Institute and the Brewers Association add
The Beer Institute, which represents large and multinational brewers, publishes its own monthly Brewer's Almanac data drawn from the same TTB underlying filings but packaged with additional context on imports, exports and tax-paid volume. Its figures tend to reach the trade slightly ahead of the raw TTB release because the institute processes them as they arrive rather than waiting for a full monthly sweep. The tradeoff is that Beer Institute releases cover the full commercial beer market — domestic and imported — in aggregate, making craft-specific breakdowns difficult to extract.
The Brewers Association, the trade body representing small and independent brewers, approaches the problem differently. Its annual production figures — the ones behind the craft segment's volume and dollar-share estimates — come from a combination of TTB data and a proprietary survey of member and non-member craft breweries. That survey allows the Brewers Association to capture breweries below the TTB's reporting thresholds and to separate craft from non-craft within the domestic total. The cost is a longer wait: the Brewers Association's annual craft production figure for a given calendar year typically publishes the following spring, making it the most complete but also the most delayed of the three sources.
How the three sources differ
The consequence for anyone citing craft's market share — around 13 percent of US beer volume while its dollar share runs considerably higher — is that the two figures often come from different periods. Volume is drawn from TTB removals data; dollar share comes from retail scanner data collected by firms such as Circana. Scanner data refreshes weekly and covers off-premise sales only, so the two numbers measure overlapping but non-identical things, updated on entirely different cycles.
Reading the lag without being misled by it
Practitioners manage the lag in predictable ways. Brewers Association economists will note when a figure is preliminary. The Beer Institute flags revisions explicitly. TTB itself publishes restated monthly data when amended returns arrive, which means a figure that was cited in one quarter can be quietly revised in the next without a press release. Trade journalists and researchers who pull TTB data directly should bookmark the statistics page and recheck figures they cited three to six months earlier, because the number on the page may have moved.
The deeper point is that the federal data infrastructure for beer was designed around tax collection, not market analysis. The excise-tax return tells the government what it is owed; volume aggregations are a by-product. That origin explains everything — the lag, the removal-versus-production distinction, the absence of style-level breakdowns — and it is why the Brewers Association's survey layer exists at all. The TTB numbers are the foundation; the survey and the scanner data are the scaffolding researchers build on top.